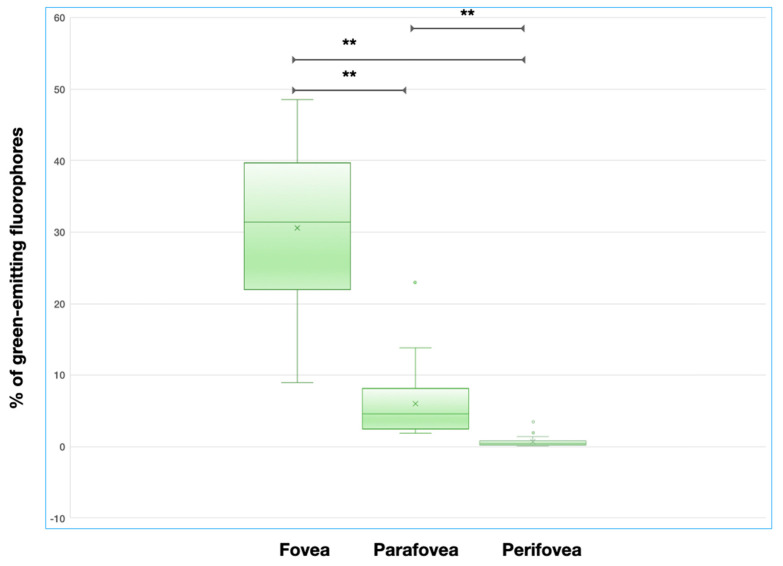
Figure 2.
Box and whisker plots showing measurements of the area occupied by green-emitting fluorophores in different analyzed regions. Each box shows median (central horizontal line), mean (“x” in the box) and interquartile range (horizontal extremes of the box) values for each variable. The ends of the whiskers represent the minimum and maximum values. Dots not included in whiskers represent outliers. Horizontal black lines marked with two asterisks indicate statistically significant differences between groups (p < 0.0001).

