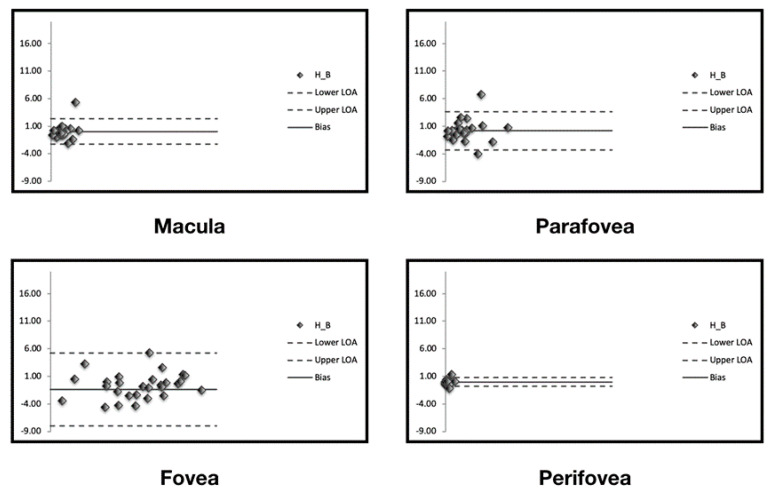
Figure 3.
Bland–Altman graphs for repeatability agreement. The Bland–Altman graphs (one for each analyzed region) show the measurement differences for the area occupied by green-emitting fluorophores between two measurements (y-axis) vs. the mean of the two measurements (x-axis). The solid line indicates the mean difference and the dashed lines indicate the 95% limits of agreement.

