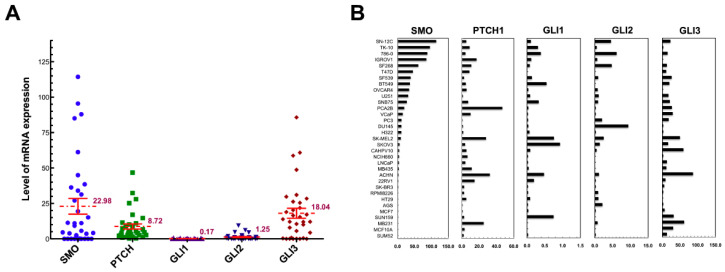
Figure 1.
The expression levels of HH signaling components. (A) Distribution of mRNA levels of SMO, PTCH, GLI1, GLI2, and GLI3 in 33 cancer cell lines. Mean values ± SCE of each gene are indicated by horizontal bars. (B) Comparison of mRNA levels. The mRNA levels of the five genes were quantitated from the Taqman RT-PCR as described in Materials and Methods. Data are presented by cell line in decreasing order of SMO mRNA level.

