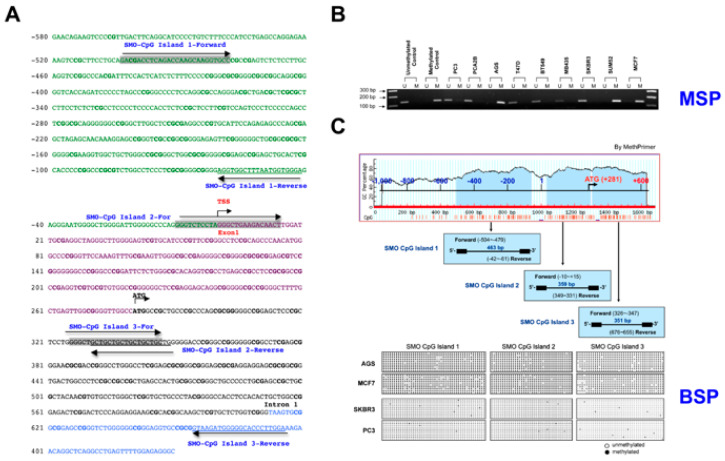
Figure 2.
Hypomethylation of the 5′-flanking region of the SMO gene. (A) Bases are numbered relative to the transcription start site at position + 1. CpG sites are shown in bold. The primers used for amplification and sequencing of bisulfate modified DNA were indicated by grey for forward and underline for reverse primer. The long arrows indicate the orientation. (B) Methylation-specific PCR analysis of the SMO upstream regulatory region in methylated/unmethylated controls and nine cancer cell lines. M indicates hypermethylated SMO; U indicates unmethylated SMO. (C) SMO promoter methylation analysis by MethPrimer. Three CpG-rich regions surrounding SMO TSS in a span of the 1611 base pairs and results of bisulfite DNA sequencing were shown.

