Figure 5.

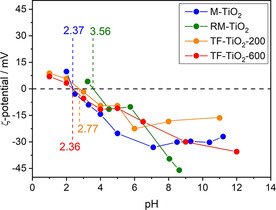
ζ‐potential curves as obtained with the samples M‐TiO2 (blue circles); RM‐TiO2 (green squares); TF‐TiO2‐200 (orange triangles) and TF‐TiO2‐600 (red triangles). The values of pHIEP are also reported

ζ‐potential curves as obtained with the samples M‐TiO2 (blue circles); RM‐TiO2 (green squares); TF‐TiO2‐200 (orange triangles) and TF‐TiO2‐600 (red triangles). The values of pHIEP are also reported