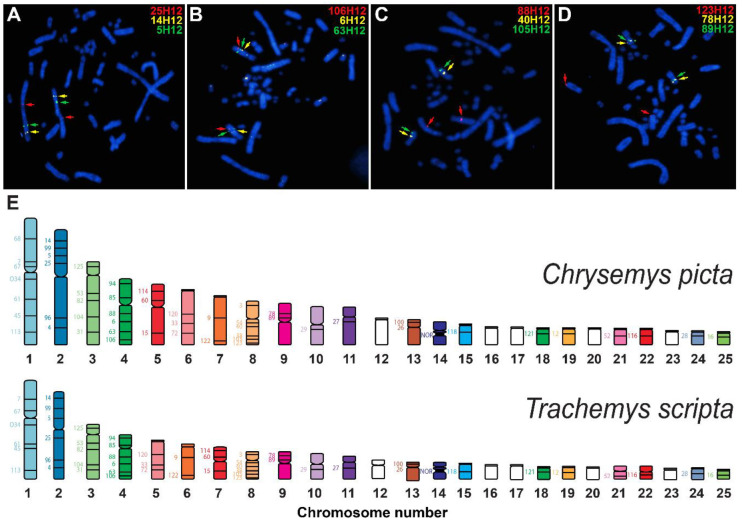
Figure 3.
Exemplar FISH results using C. picta BACs to hybridize onto T. scripta chromosomes (A–D), and broad-level chromosome homology between these species based on BAC-FISH data (E). Numbers on the left of the ideograms in panel (E) denote the ID and position of the BACs hybridized. White chromosomes in panel (E) denote T. scripta chromosomes without mapped BACs to date, whose homology remains unknown. The red hybridization signal in panels (A), (B) and (D) is subtle such that zooming in may be needed for better visualization.

