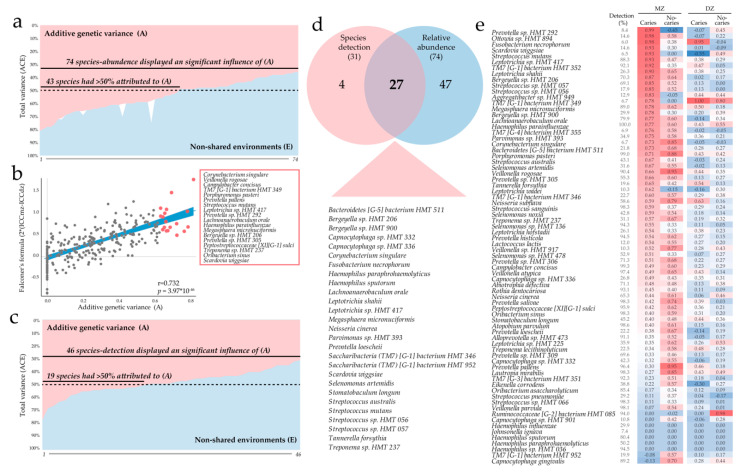
Figure 4.
Oral microbiota heritability. (a) additive genetic (A) versus unique environment (E) scores for bacterial species with sex, birth-year, and Illumina run adjusted statistically significant A score for species abundance; (b) comparison of A scores for abundance and scores by the Falconer’s formula (2 × (ICCmz-ICCdz); (c) A and E score for species detection of species. Variance explained by component C in (a) and (c) is shown in white. (d) Venn diagram showing bacterial species with a statistically significant A score for both detection and abundance (n = 27); (e) heatmap showing ICC scores for bacterial species with a statistically significant A score by MZ and DZ and caries status (caries-free versus caries-affected).

