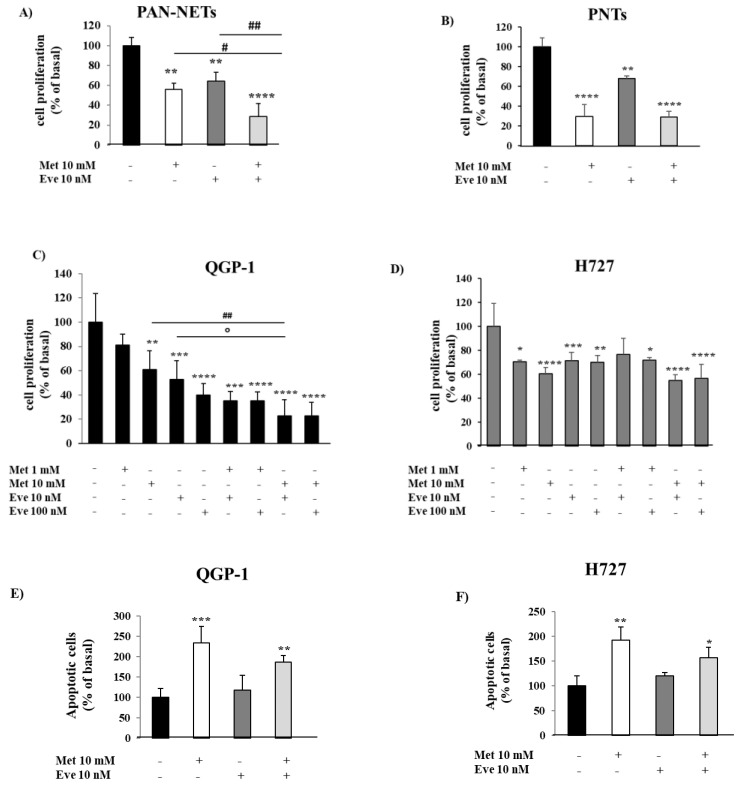
Figure 1.
The effect of metformin (Met) and everolimus (Eve) on neuroendocrine tumor (NET) cell proliferation and apoptosis. (A,B) To measure cell proliferation, we incubated primary NET cells with metformin 10 mM and everolimus 10 nM, alone or in combination, for 24 h, then with BrdU for 24 h. Experiments were repeated 3 times and each determination was done in triplicate. Basal = untreated control. Values represent mean (± SD.) ** = p < 0.01, **** = p < 0.0001 vs. corresponding basal, # = p < 0.05, ## = p < 0.01 vs. single drug. Statistical analysis was performed with a one-way ANOVA followed by Tukey’s post-hoc test. (C,D) To measure cell proliferation, QGP-1 and H727 cell lines were incubated for 24 h with metformin (1–10 mM) and everolimus (10–100 nM), alone or in combination, and then treated with BrdU for 2 h. Experiments were repeated at least 4 times and each determination was done in triplicate. Values represent mean (±SD.) * = p < 0.05, ** = p < 0.01, *** = p < 0.001, **** = p < 0.0001 vs. corresponding basal, ## = p < 0.01 vs. metformin, ° = p < 0.05 vs. everolimus. (E,F) The graph shows the percentage of apoptotic cells after metformin (10 mM) and everolimus (10 nM) treatment, alone or in combination, compared to basal. Only metformin 10 mM significantly increased the rate of apoptosis. Values represent mean ± SD of 3 experiments. * = p < 0.05, ** = p < 0.01, *** = p < 0.001 vs. corresponding basal. Statistical analysis was performed with a one-way ANOVA test followed by Dunnett’s post-hoc test.

