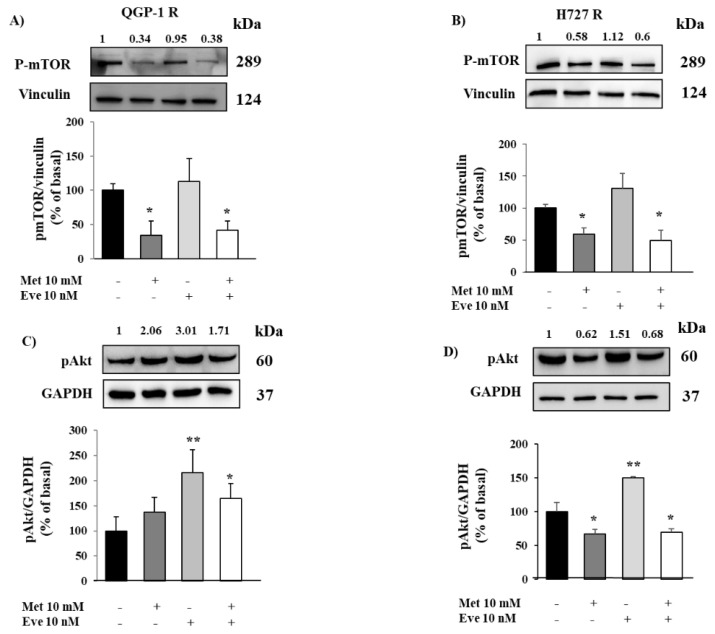
Figure 7.
The effect of metformin (Met) on mTOR and Akt phosphorylation in QGP-1-R and H727-R cells. (A,B) Representative immunoblots of phospho-mTOR demonstrating that metformin continued to inhibit mTOR phosphorylation in everolimus-resistant QGP-1-R and H727-R cells. Graphs show the quantification of phospho-mTOR normalized to the housekeeping gene vinculin (mean value ± SD from 3 independent experiments). * = p < 0.05 vs. corresponding basal. Statistical analysis was performed with a one-way ANOVA test followed by Dunnett’s post-hoc test. (C,D) Representative immunoblots of p-Akt, after metformin and everolimus incubation, alone or in combination. Metformin did not affect Akt phosphorylation in QGP-1-R cells, conversely, significantly decreased p-Akt in H727-R cells. Graphs show the ratio of p-Akt/GAPDH normalized to basal (mean value ± SD from 3 independent experiments). * = p < 0.05, ** = p < 0.01 vs. corresponding basal. Statistical analysis was performed with a one-way ANOVA test followed by Dunnett’s post-hoc test. Unprocessed images for WB results see Figures S4 and S5.

