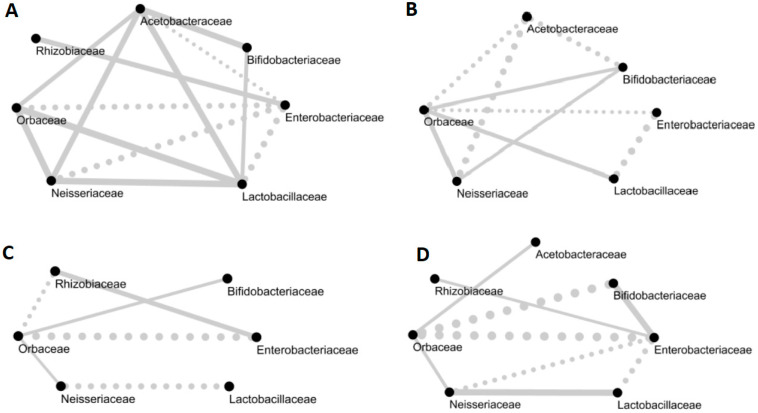
Figure 2.
Networks of the core bacterial families of the honeybee gut on (A) September 6, (B) November 2, (C) April 27 and (D) June 1. Full lines indicate a positive correlation and dotted lines indicate negative correlations. Correlations under 0.3 are not displayed in the networks. The thickness of the line is proportional to the value of the correlation between two families.

