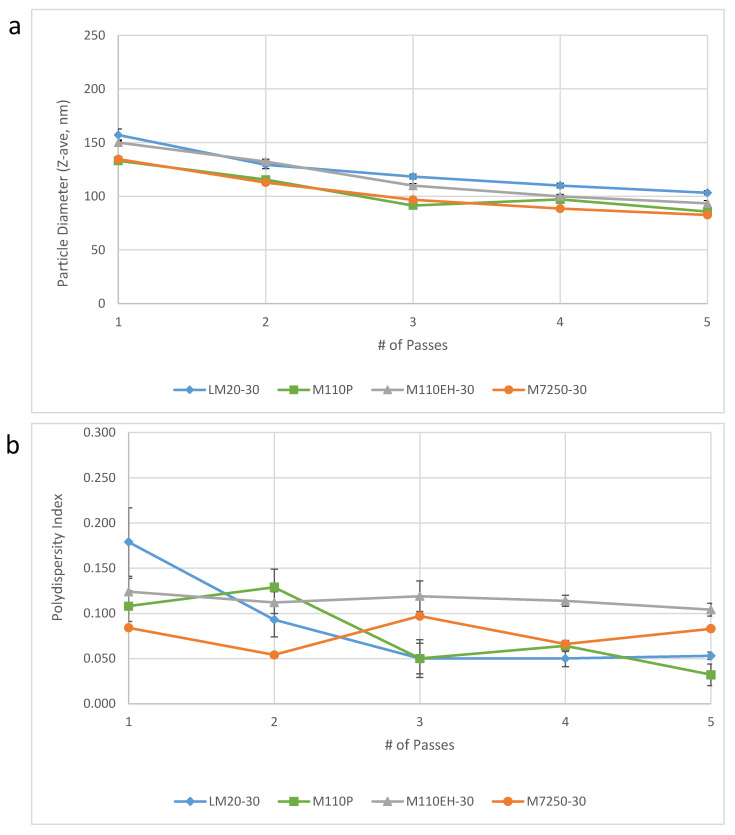
Figure 4.
Droplet diameter (a) and polydispersity index (b) as a function of number of passes through the indicated Microfluidizer processor model. Error bars represent the standard deviation from three measurements from the same aliquot. The M-7250-30 data are taken from Figure 3. Batch size produced for each model was 10 L (M7250-30), 300 mL (M110-EH), 200 mL (M110P), and 100 mL (LM20). Typical representative flow rate for each Microfluidizer model when processing at 30,000 psi is 2.8 L/min (M7250-30), 400 mL/min (M110-EH), 110 mL/min (M110P), and 80 mL/min (LM20). Prior to Microfluidizer processing, high shear mixing conditions and equipment varied somewhat for the different batches although minimal impact is anticipated from these differences.

