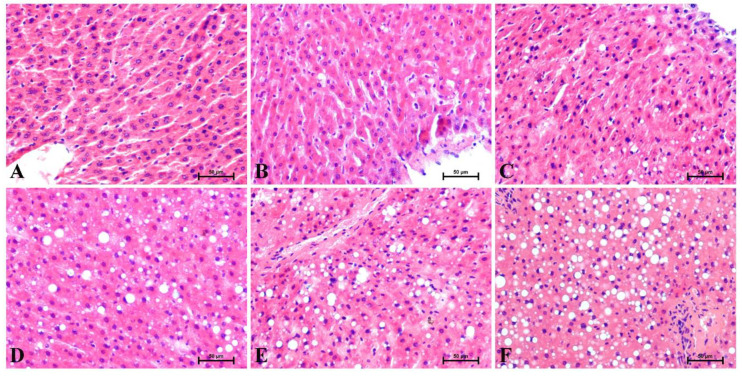
Figure 1.
Representative hematoxylin and eosin (H + E) stains of the liver sections at the individual time points from (A) 0 week, as the control group, and the experimental HFD weeks: (B) 1, (C) 2, (D) 3, (E) 4 and (F) 5. The results from each rat (n = 6) were collected as independent determinations of the specific parts of the liver lobes. 200× magnification. On the lower right, the calibration bar equals 50 μm.

