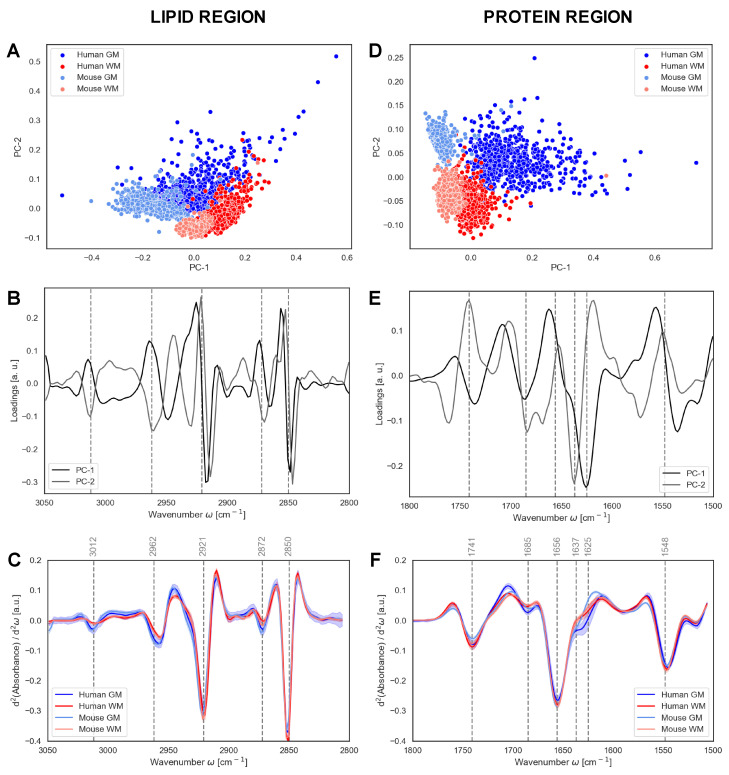
Figure 3.
Principal Component Analysis (PCA) of grey matter (GM) and white matter (WM). PCA of the normalized second derivatives of the lipid region (3050–2800 cm−1) and protein region (1800–1500 cm−1), showing the scores plots (A,D), the resulting loadings for PC-1 and PC-2 (B,E) and the average spectra (C,F) of the two regions, respectively. Spectra shadowing in C and F indicates standard deviation. a.u.—arbitrary units.

