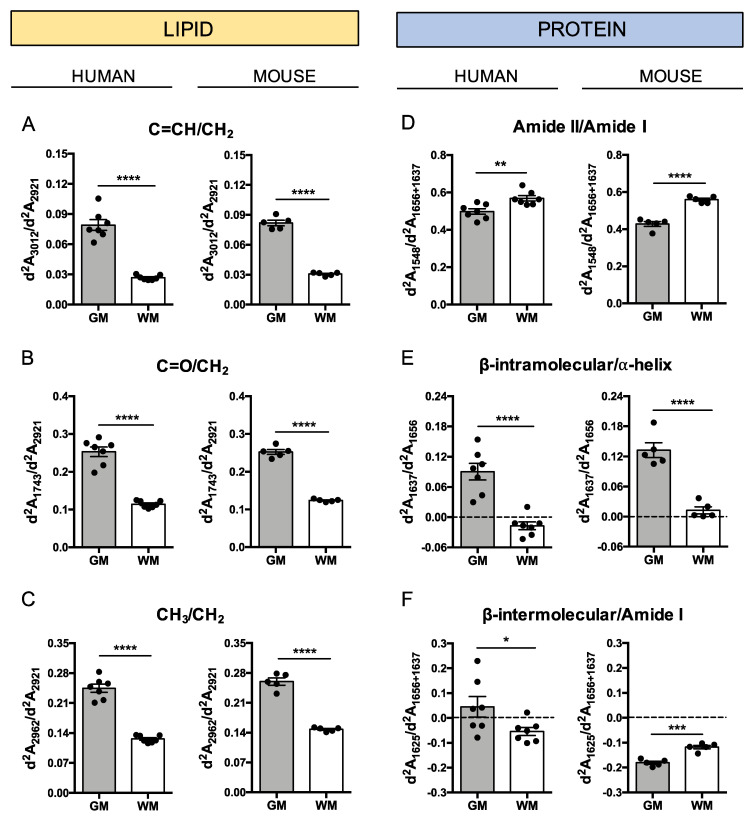
Figure 4.
Chemical properties of lipids and proteins in grey matter (GM) and white matter (WM). Graphs represents absorbance second derivative (d2A) ratios of functional groups related to lipids (A–C) and proteins (D–F) in human and murine brain samples. Each dot in the graphs correspond to the mean of approximately 100 infrared measurements from a subject. * p-value < 0.05; ** p-value < 0.01; *** p-value < 0.001; **** p-value < 0.0001.

