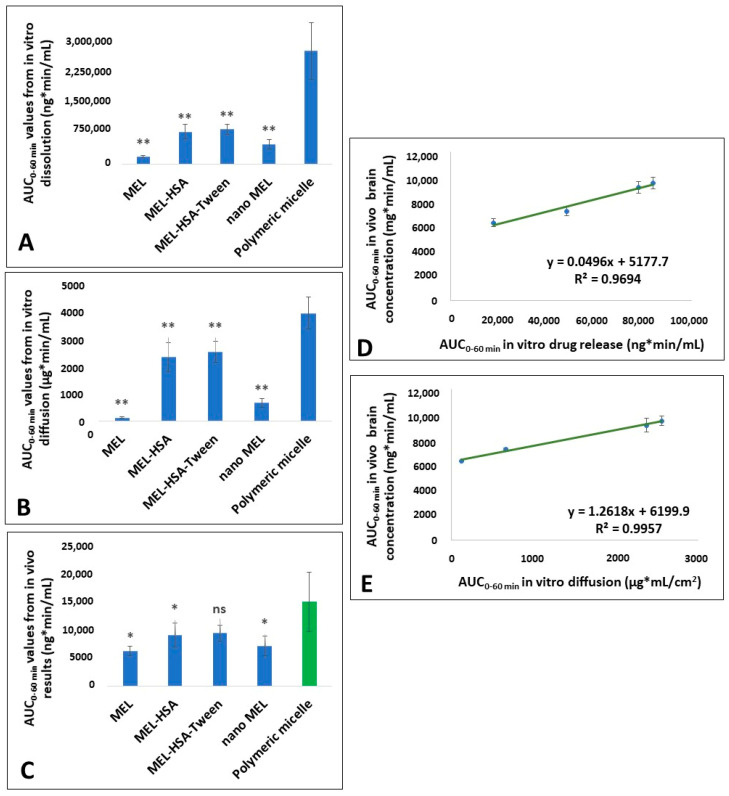
Figure 12.
Figures of the IVIVC evaluation. (A) Calculated AUC0–60 min values from the in vitro dissolution test; (B) Calculated AUC0–60 min values from the in vitro diffusion test; (C) AUC0–60 min values from the in vivo results with the predicted polymeric micelle value (marked as green); (D) Pearson correlation based on dissolution; (E) Pearson correlation based on diffusion. Statistics: * = p < 0.05; ** = p < 0.01; ns = not significant.

