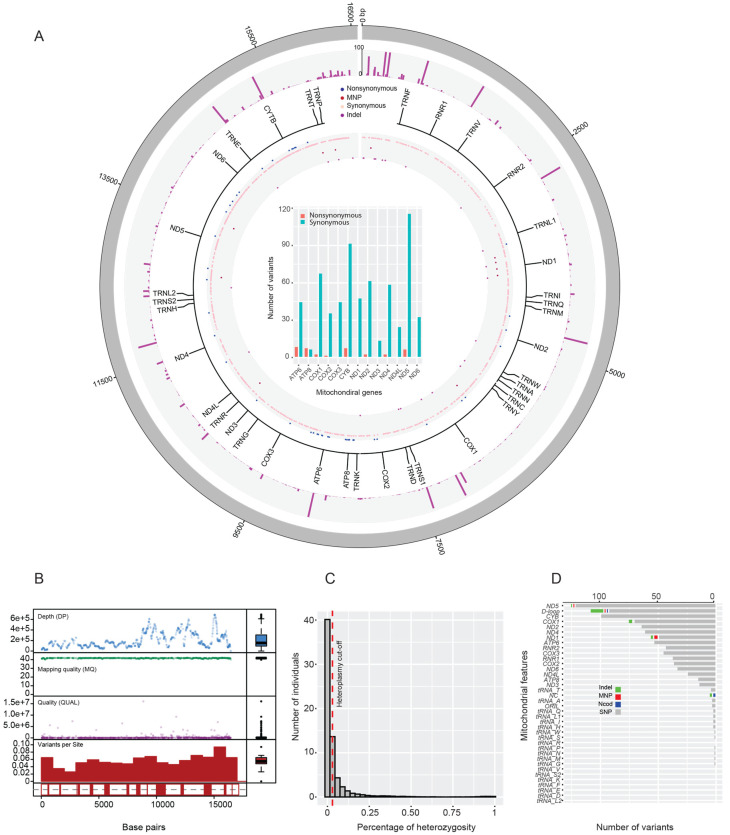
Figure 1.
Mitochondrial genomic variation within the UAE population. (A) Circos plot depicting the overall mitochondrial genomic variation. From the outer to inner rings: (1) variant allele frequency, (2) variant type, and (3) gene positions. The inner barplot shows the synonymous and nonsynonymous variants for each mitochondrial gene. (B) Quality control statistics such as depth of coverage (DP), mapping quality (MQ), and quality of variants (QUAL), as well as the number of variants per site. (C) Percentage of heterozygosity as a proxy for heteroplasmy for heterozygote variants depicted on the x-axis. The y-axis is the number of individuals with heteroplasmic locus. (D) The number of variants distribution per mitochondrial gene, RNR, tRNA, and noncoding.

