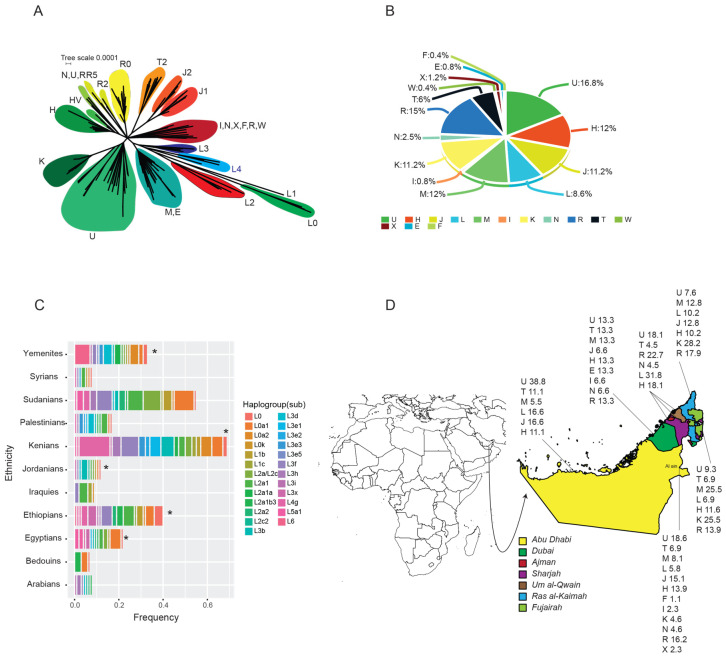
Figure 2.
Haplogroup distribution and frequency. (A) Network haplogroup tree depicting the ancestral (L) haplogroups and the out of Africa haplogroups. (B) Total haplogroup frequencies for the UAE population. (C) Stacked bar plots for the frequencies of L3 haplogroup from different Levant and African countries. Stars highlight the presence of L3x1b sub-haplogroups in these countries. (D) A map of Africa and the Arabian Peninsula and a zoom on the UAE map with highlights of the different haplogroup frequencies for the different cities of the UAE.

