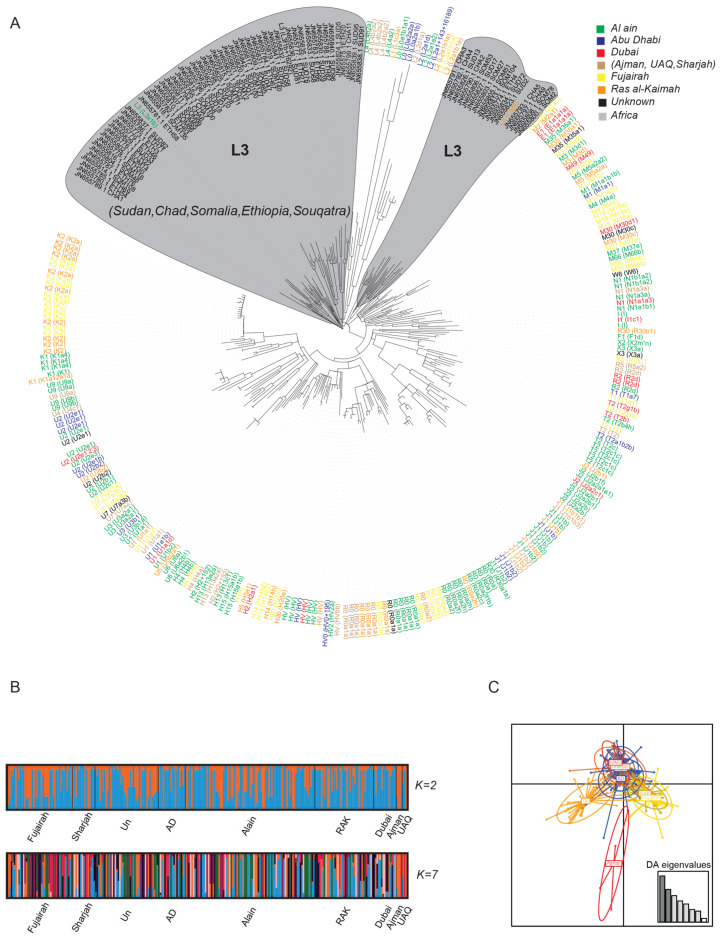
Figure 3.
Population structure in UAE population. (A) Maximum likelihood phylogenetic tree depicting the network relationship among the different haplogroups (sub-haplogroups), where they are color-coded by city/region. (B) Admixture plot for K = 2 and K = 7 ancestral population. (C) Discriminant Analysis of Principal Component (DAPC) showing the clustering of the different cities of the UAE population.

