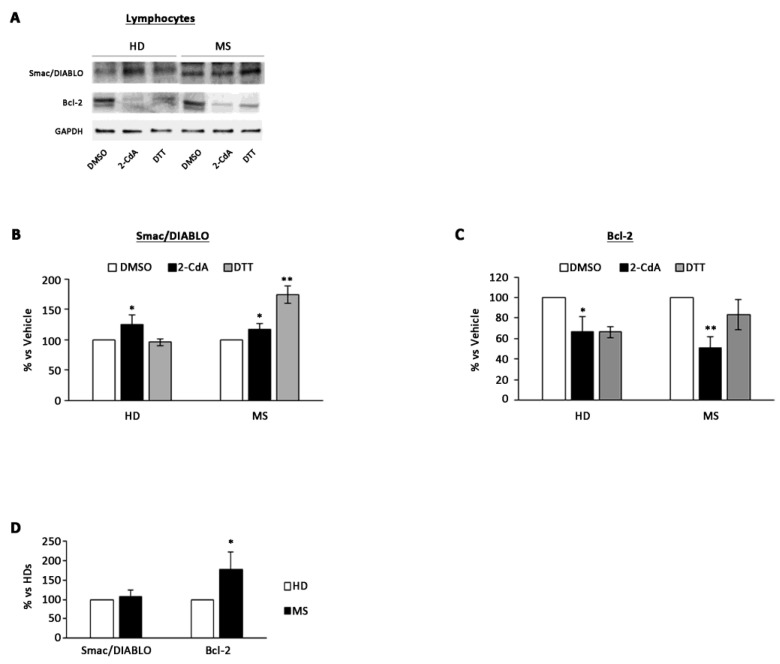
Figure 1.
Effect of 2-CdA treatment on Smac/DIABLO and Bcl-2 protein expression in HDs and multiple sclerosis (MS) lymphocytes. (A) Representative Western blot of Smac/DIABLO and Bcl-2 levels performed on whole cell lysates. Bar graphs show quantification by densitometric analysis of Smac/DIABLO (B) and Bcl-2 (C) protein band normalized to GAPDH, used as loading control. Values (mean ± SEM of three independent experiments) are expressed as percentage of dimethyl sulfoxide (DMSO). (D) Bar graph showing densitometric analysis of Smac/DIABLO and Bcl-2 protein levels in healthy donors (HD) and multiple sclerosis (MS) lymphocytes not exposed to cladribine (2-CdA). Significance was calculated with Student’s t-test; * p < 0.05, ** p < 0.005 vs. DMSO (B,C) or vs. HDs (C). DTT, dithiothreitol.

