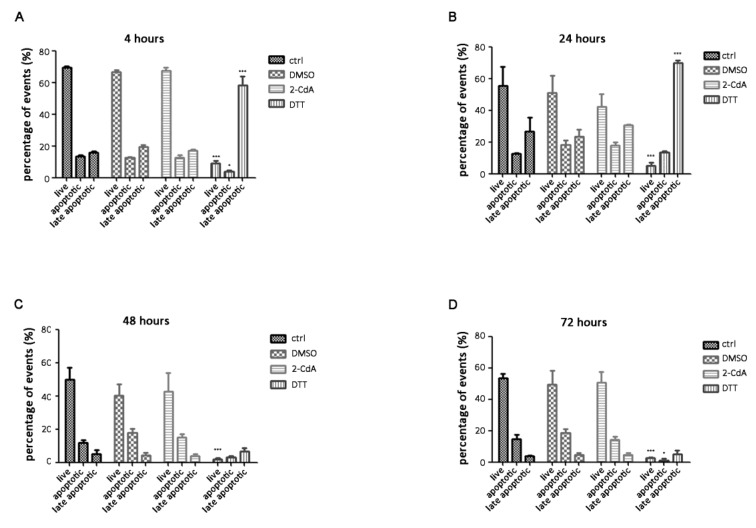
Figure 5.
Histograms showing the percentage of live, apoptotic, and late apoptotic events at different timepoints. SH-SY5Y cells were analyzed by annexin V/SYTOX Green assay after exposure to 20 nM 2-CdA (2-CdA), dimethyl sulfoxide (DMSO), 20 mM dithiothreitol (DTT), and not treated cells (ctrl) for 4 (A), 24 (B), 48 (C), and 72 h (D). Data are expressed as mean ± SD and statistical analysis was computed using one-way ANOVA followed by the Newman–Keuls test; * p < 0.05, *** p < 0.001.

