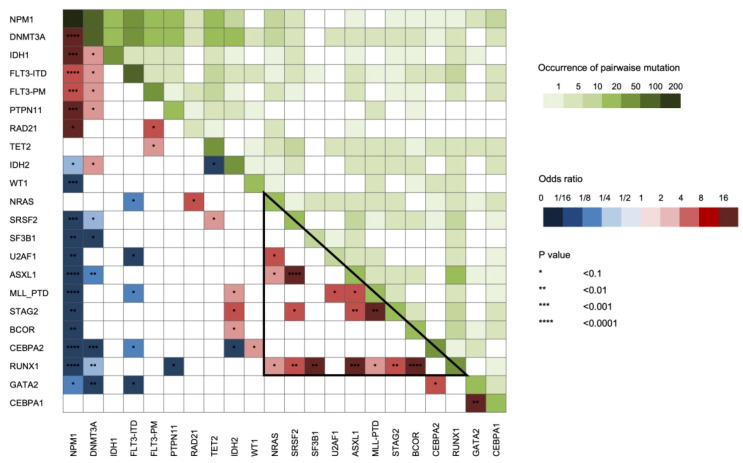
Figure 4.
Pairwise association among gene mutations. The odds ratio of the association is color coded: blue colors indicate a negative association while red colors indicate a positive association. In addition, differential green intensity represent a different co-occurrence of mutations in terms of number of patients. Triangle indicates a group of genes which frequently co-mutate in NPM1 wild-type AML. CEBPA2 and CEBPA1 indicate the presence of double or single mutation, respectively.

