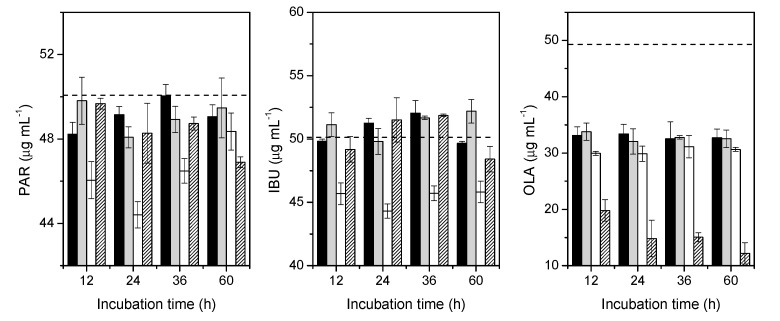
Figure 6.
PAR, IBU and OLA removal by Nannochloropsis sp. in continuous cultures for 60 h. f/2 medium (black), Beads (gray), Immobilized (white) and Free cells (black lines). Horizontal dashed lines represent the concentration at t = 0. The chromatogram shows an overestimated determination for IBU concentrations that corresponds to expected fluctuations in the measurements (the error in the concentration determination is around 4%). Bars represent the SD.

