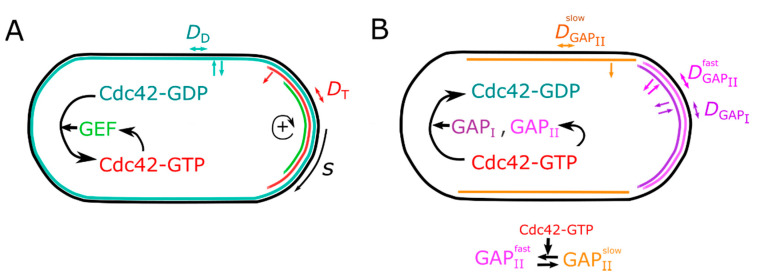
Figure 1.
Modeling Cdc42 activation and regulator distribution. (A) Schematic illustrates GEF-mediated positive feedback at cell tips, with colored regions indicating zones of active Cdc42-GTP patch. The model equations are identical for both tips; however, they allow symmetry-breaking states and one dominant tip as shown. Parameter s indicates arc length distance from the nearest cell tip. Colored arrows indicate association, dissociation, and diffusion along cell membrane. Cdc42-GDP (teal) associates, dissociates, and diffuses on the plasma membrane with diffusion coefficient . It converts to slowly-diffusing Cdc42-GTP (red, diffusion coefficient ) by GEF (green) that is recruited to the membrane by Cdc42-GTP in a nonlinear manner, establishing a positive feedback (+ arrow). (B) Schematic illustrates the negative feedback through GAPs. GAPI (purple, diffusion coefficient ) and fast-diffusing GAPII (pink, diffusion coefficient ) are recruited to the membrane through Cdc42-GTP. Fast-diffusing GAPII spontaneously converts to slow-diffusing GAPII (orange, diffusion coefficient ), while the reverse (slow to fast) is catalyzed by Cdc42-GTP. All GAPs catalyze hydrolysis of Cdc42-GTP.

