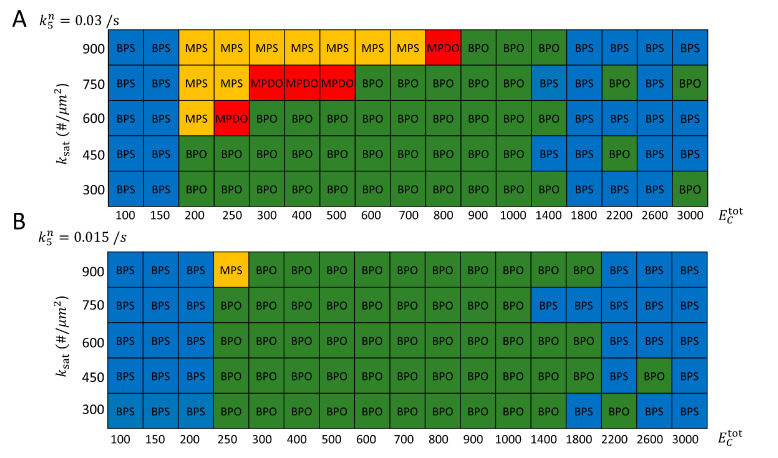
Figure 5.
Structure of dynamical states reached, as function of total GEF amount () and negative feedback parameter . Results show the final state reached by a single simulation for each set of parameters over time course of 800–1200 s, starting from an unpolarized state. Other parameters same as Table 1. (A) Reference simulations. For = 600−900/μm2, the system can transition from MPDO to BPO with increasing , a behavior consistent with the dynamical change observed under cell growth around NETO. (B) Same as panel A but reducing the rate of GAPII recruitment to the cell tips, as might occur in rga4Δ or rga6Δ cells. The BPO region is observed to expand compared to panel A, while the region corresponding to MPS and MPDO states shrinks.

