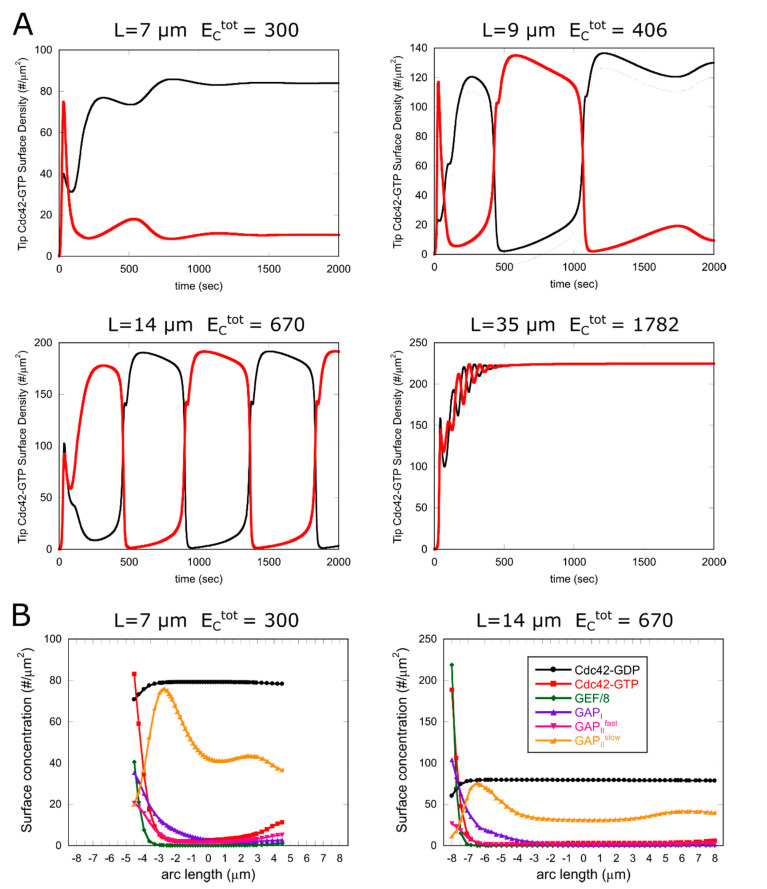
Figure 6.
Results of simulations at different fixed cell lengths, L, and increasing the total GEF in proportion to cell volume, as indicated in each graph. Other parameters same as Table 1, except for = 650/μm2. (A) Plots of Cdc42-GTP concentration at each tip (red and black curve) as a function of time starting from an unpolarized state with both tips inactive. System transitions from MPDO to BPO and BPS with increasing L. (B) Concentrations as a function of arc length distance from cell tip for a cell of length 7 μm (left, at steady asymmetric state) and length 14 μm (right, after 1060 s of simulation of cell undergoing symmetric oscillations, at an instant with a dominant left tip).

