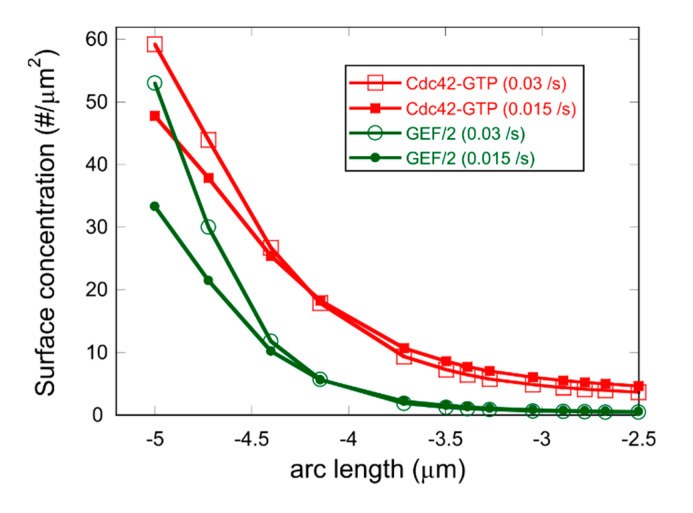
Figure 7.
Plot of Cdc42-GTP and GEF concentration gradient when the rate of GAPII recruitment to the cell tips is (empty symbols) and for the same parameters with reduced rate of (solid symbols), as might occur in rga4Δ cells. Other parameters are the same as Table 1 except , such cases result in BPO oscillations (see Figure 5B). This plot shows the concentration profiles at the dominant tip ~ 20 s after Cdc42-GTP tip concentration peaks, and after at least 1000 s of simulation time. The half-widths are larger with reduced GAPII recruitment rate: An exponential fit to the Cdc42-GTP profile gives a decay length and , respectively. The left-most point on the x axis corresponds to the left tip, as in Figure 2.

