Figure 2.
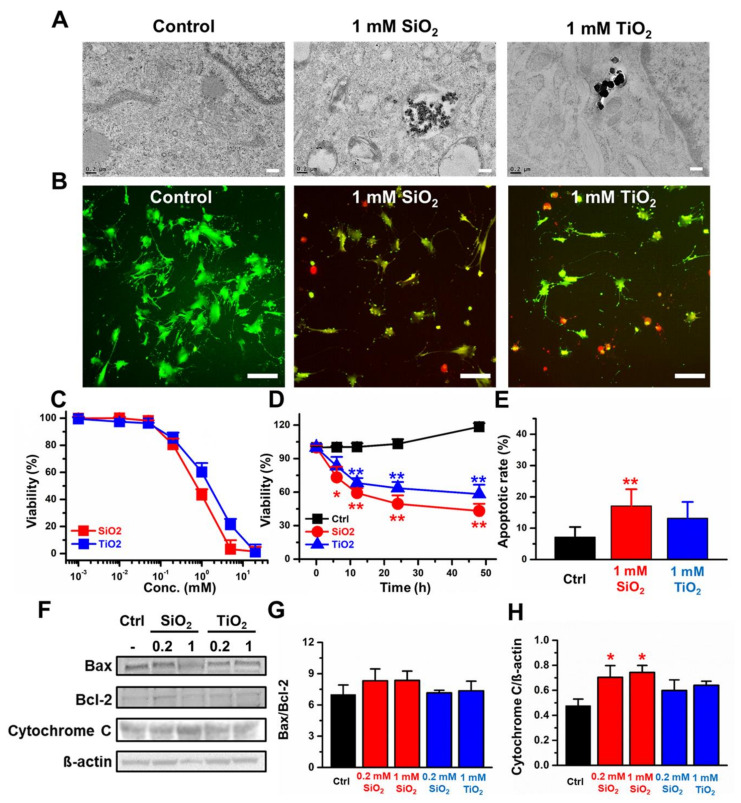
The cytotoxicity induced by SiO2 and TiO2 nanoparticles in 2D CCD-18Co. (A) Transmission electron microscopy (TEM) images of the control and the SiO2 and TiO2 nanoparticles endocytosed by CCD-18Co cells. The scale bar in represents 0.2 µm. (B) Live/dead assay (Green: live cells, Red: dead cells). Scale bars represent 20 µm. (C) Concentration-dependent viability. (D) Incubation time-dependent viability, (E) % cells undergoing apoptosis. (F) Western blots. (G) Quantitative analysis of the Bax/Bcl-2 protein expression ratio. (H) Quantitative analysis of the Cytochrome C/ß-actin ratio of the 2D CCD-18Co cells treated with the SiO2 and TiO2 nanoparticles. Error bars represent the standard deviation of three replicates. * For p < 0.05, ** for p < 0.01.

