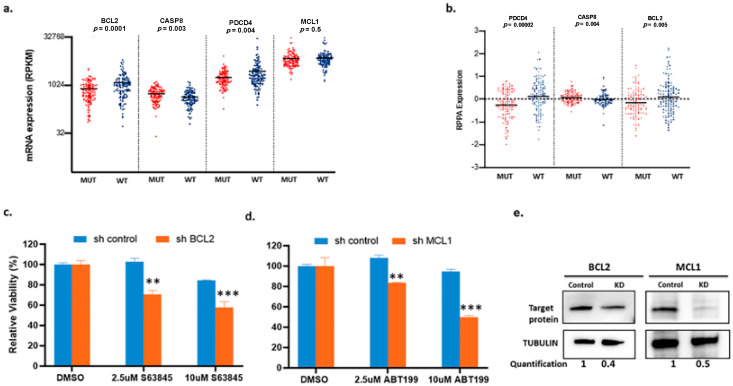
Figure 1.
Differential expression of apoptotic-related mRNA and proteins in The Cancer Genome Atlas Network (TCGA) cutaneous melanoma dataset and the effects of knocking down B-cell CLL/lymphoma 2 (BCL2) or myeloid cell leukemia sequence 1 (MCL1). (a and b) Comparison between two genotypic groups: BRAF-hotspot mutated (MUT) (n = 110) and BRAF-wild-type (WT) (harboring RAS hotspot mutated, any NF1 mutated, and triple wild type n = 122). (a) mRNA expression values for BCL2, CASP8, PDCD4, and MCL1. (b) Relative reverse phase protein array (RPPA) protein expression values for PDCD4, CASP8, and BCL2. MCL1 was not included on the RPPA panel. Each dot represents an individual sample, and the horizontal line represents the mean. (c) and (d) show the effects of BCL2 or MCL1 knockdown in A375 cells. Cells were treated with the indicated drugs for 48 h. Knocking down BCL2 (shBCL2) sensitized cells to MCL1 inhibitor S63845 and knocking down MCL1 (shMCL1) sensitized cells to BCL2 inhibitor ABT-199. Y-axis shows percentage of relative viability and X-axis indicates the BH3 mimetics used. ** indicates p < 0.01; *** indicates p < 0.001. Error bars represent +/− SEM. (e) Immunoblots to confirm the knockdown.

