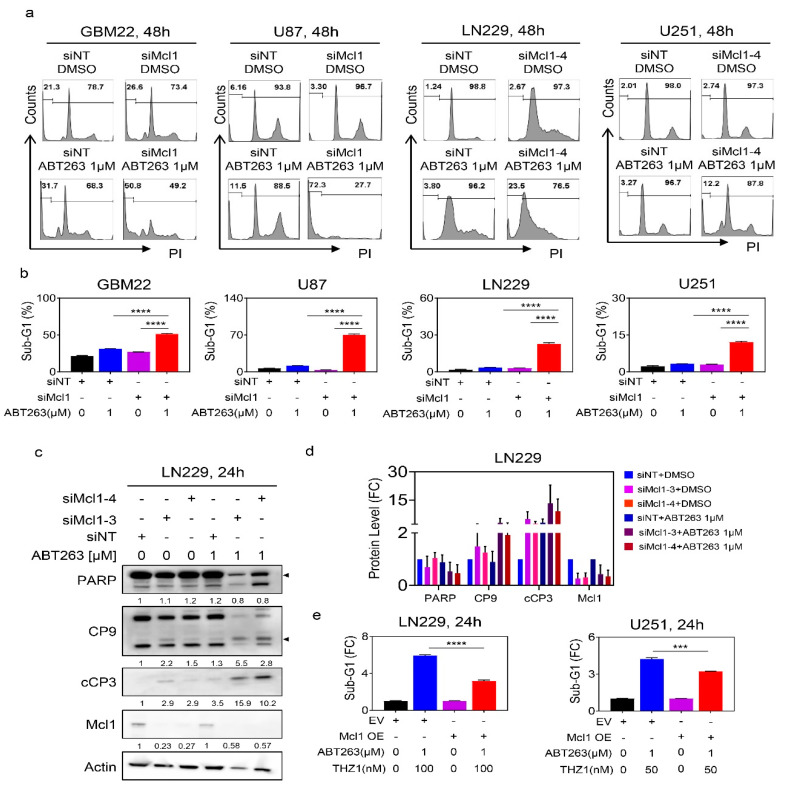
Figure 5.
Down-regulation of Mcl-1 is necessary and sufficient for the combination treatment of ABT263 and THZ1 to exert its killing effects on GBM cells. (a) Shown are representative flow plots of GBM22, U87, LN229, and U251 cells transfected with control (siNT) or specific Mcl1 siRNAs, treated with ABT263, and labeled with propidium iodide followed by flow cytometry to detect the sub-G1 fraction; (b) The graphs show the Sub-G1 fraction of GBM22, U87, LN229, and U251 cells transfected with control (siNT) or specific Mcl1 siRNAs and subsequent treatment with vehicle or ABT263 (n = 3). ANOVA was used for statistical analysis; (c) Standard western blots of cell lysates of LN229 cells that were transfected with control (siNT) or two specific Mcl-1 siRNAs and were treated with DMSO or 1µM ABT263. The protein expression levels were quantified using ImageJ (shown in cursive font). Arrow heads show the quantification of the protein levels of total PARP and cleaved CP9. Uncropped blots are shown in Figure S10; (d) The protein expression levels of PARP, CP9, cCP3, and Mcl1 of LN229 cells that were transfected with control (siNT) or two specific Mcl-1 siRNAs and were treated with DMSO or 1µM ABT263 (n = 2–3). FC: fold change; (e) LN229 and U251 cells were transfected with empty vector or Mcl1 over-expressing vector and were treated with the combination of ABT263 and THZ1 for 24 h. Cells were labeled with propidium iodide and the quantifications are provided. Shown are means and SD. Statistical significance was determined by two-tailed Student’s t-test. ***/**** p < 0.001.

