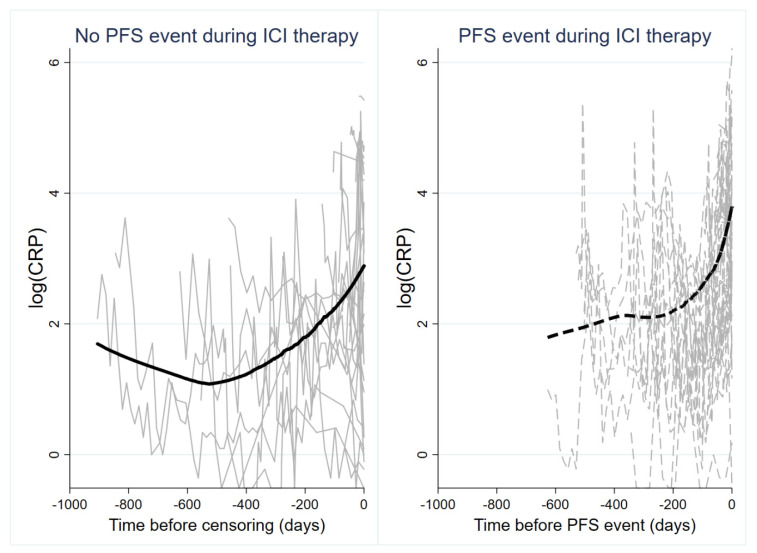
Figure 4.
Line plot of CRP trajectories in patients who did (right panel, gray dashed lines) and did not (left panel, gray solid lines) develop a PFS event during ICI therapy. Each line represents the log(CRP) trajectory of a single patient. The bold solid line (left panel) and bold dashed line (right panel) represent moving averages (locally weighted sum-of-squares (LOWESS) nonparametric smoother). Note that the time on the x-axis of both panels is inverted, i.e., it represents the time before a PFS event or censoring without a PFS event. Abbreviations: PFS—progression-free survival; ICI—immune checkpoint inhibitor.

