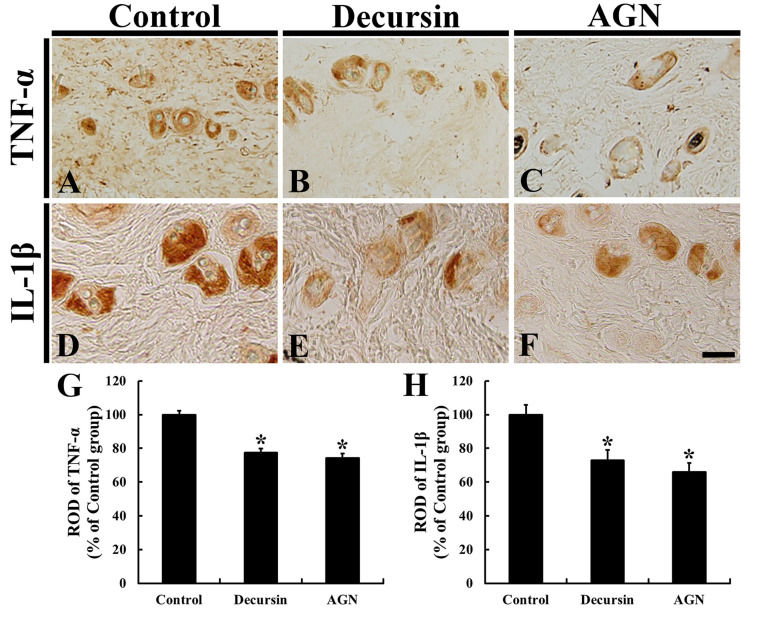
Figure 5.
Immunohistochemistry for TNF-α (A–C) and IL-1β (D–F) in the dorsal skin of the control (A,D), decursin (B,E) and AGN (C,F) groups at 17 days. Regarding the decursin and AGN groups, both TNF-α and IL-1β immunoreactivities are significantly weakened compared to those in the control group. Scale bar = 40 μm. (G,H): ROD of TNF-α (G) and IL-1β (H) (n = 10 in each group; * p < 0.05 versus control group). The bars indicate the means ± SEM.

