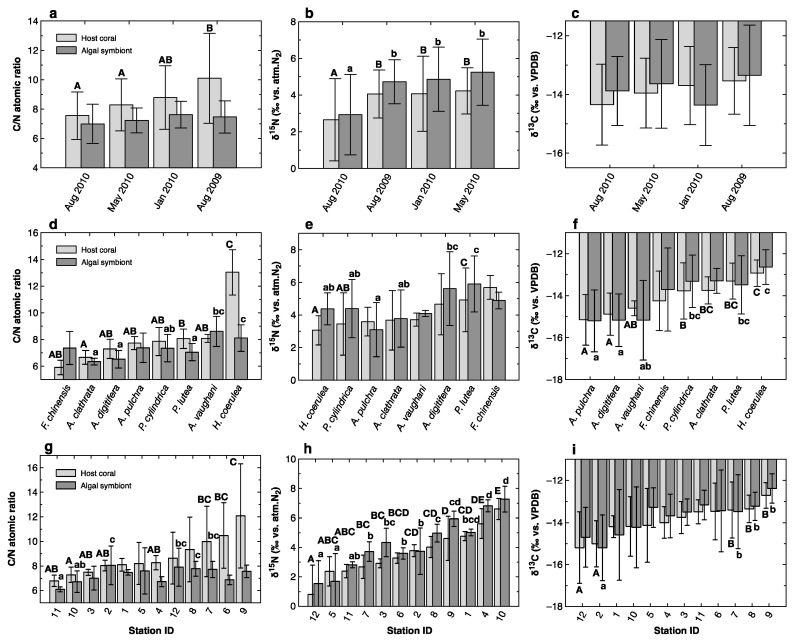
Figure 3.
Comparison of average C/N ratios (a,d,g), δ15N values (b,e,h), and δ13C values (c,f,i) of host-coral (thin grey) and symbiotic algal (thick grey) fractions of coral samples among sampling events (a–c), species (d–f), and sampling sites (g–i). The data were averaged and arranged in increasing order based on host-coral fraction values in each plot. Error bars represent standard deviation. Differences among events, species, and sites were evaluated using the Tukey–Kramer multiple comparison test (α = 0.05), and different characters at the top of the error bars indicate statistically significant differences. Upper- and lower-case characters correspond to the host coral and symbiotic algal fractions, respectively. Lack of characters indicates that no significant difference was detected.

