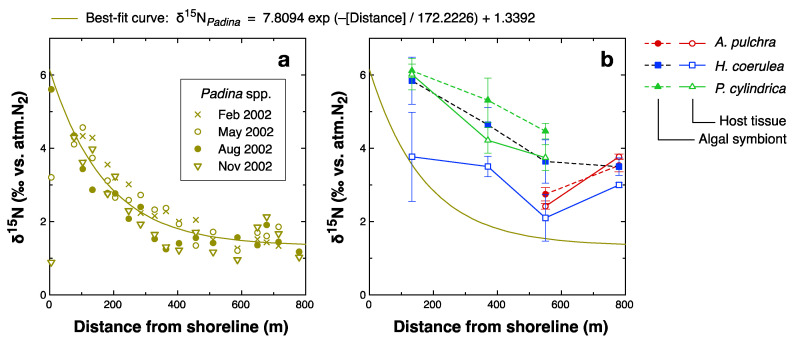
Figure 6.
Spatial distribution of bulk δ15N values across the reef flat of Shiraho Reef (Figure 1b). (a): δ15N values of the macroalgae Padina spp. collected in 2002 (redrawn from [84]). Sampling points are shown in Figure 1b (open circles). Solid lines in (a,b) are best-fit exponential curves for macroalgal δ15N values. (b): δ15N values of coral samples measured in this study. Sampling points from left to right are Stations 9, 8, 7, and 6. Error bar represents standard deviation.

