Figure 4.
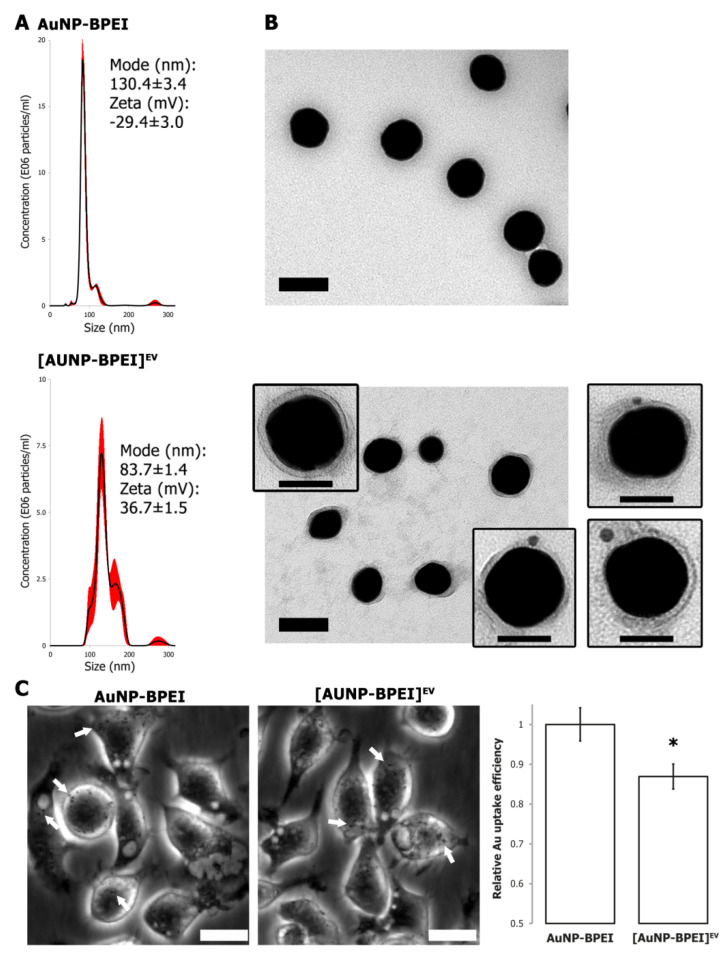
Functionalization of AuNP by EV membranes. (A) NTA size distribution of AuNP-BPEI versus AuNP-BPEI cloaked with EV membranes, depicted as mean (black line) with standard error (red shaded area). Inset: size mode (nm) and mean zeta potential (mV) ± standard error. (B) Transmission electron microscopy of AuNP-BPEI and EV-cloaked AuNP-BPEI. Scale bar: 100 nm. Inserts: CD9 immunoelectron microscopy of EV-cloaked AuNP-BPEI. Scale bar: 50 nm. (C) Left panels: Phase contrast images of J774A1 macrophages after 16 h incubation with AuNP-BPEI or [AuNP-BPEI]EV. White arrows indicate phagocytosed AuNP aggregates. Scale bar: 20 µm. Right panel: Quantification of AuNP uptake by determination of total Au concentration via ICP-MS. Asterisk indicates significantly different value (*, two-sided t-test, p = 0.01).

