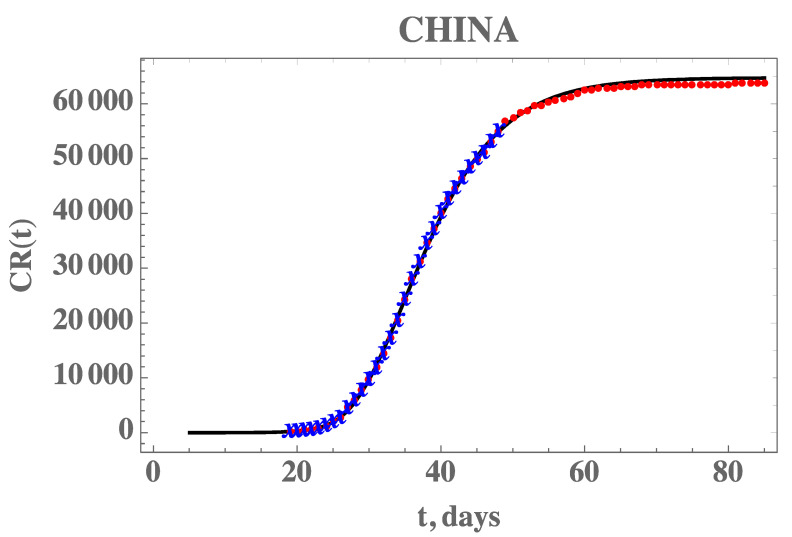
Figure 3.
Comparison of the theoretical model for CR(t) with the three estimated parameter values from Table 3 (solid line), against the dataset for China from 19 January to 17 February (blue stars) and from 18 February to 16 April (red dots)—Case 1: CH3p.

