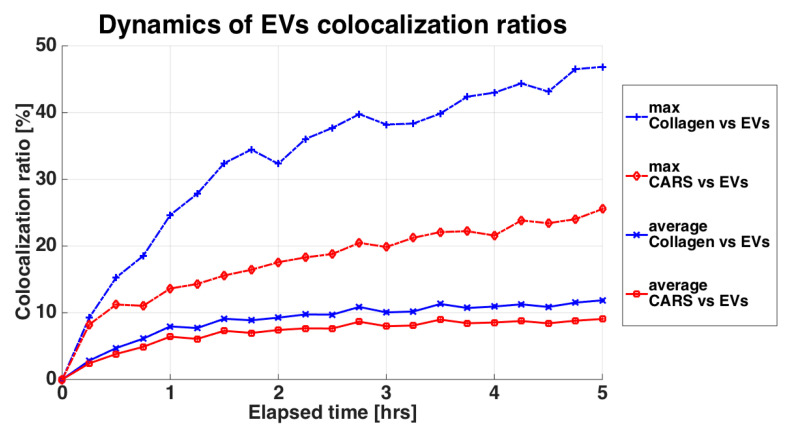
Figure 5.
Variation of the co-localization ratios of the EVs with respect to the SHG signal and to the CARS signal. SHG is related to the collagen and thus the extracellular matrix, shown in blue. CARS is related to the lipid cell structures, shown in red. The curves indicate the maximum co-localization value and the average co-localization value computed from the set of Z slices composing the Z-stack for each timeframe.

