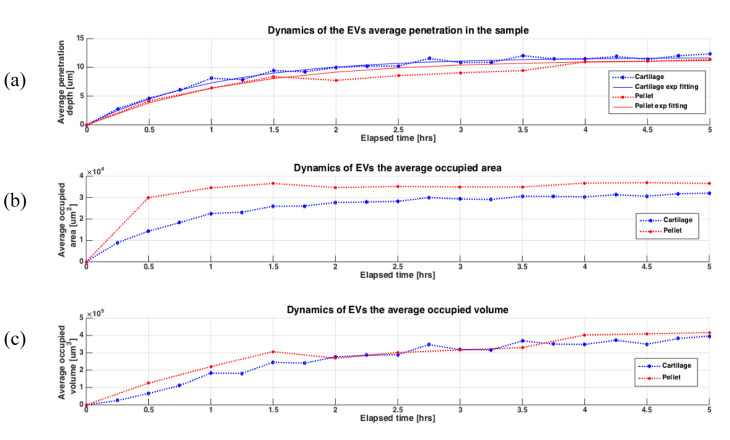
Figure 7.
Dynamics of the EV uptake in the samples during the time-lapse experiment in terms of the average thickness of penetration, the average occupied area and the average occupied volume. (a) the dotted curves show the average EV penetration depth in the cartilage (blue) and the chondrocytes pellet (red), while the continue curves plot the related exponential fit for the cartilage (blue) and the chondrocytes pellet (red); (b) the dotted curves show the average occupied area of the EVs in the cartilage (blue) and the chondrocytes pellet (red); (c) the dotted curves show the average occupied volume of the EVs in the cartilage (blue) and the chondrocytes pellet (red).

