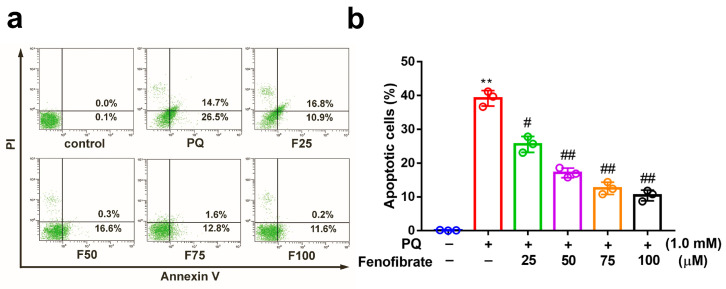
Figure 2.
Effects of fenofibrate on apoptosis in paraquat (PQ)-stimulated RF/6A cells assessed by flow cytometry. (a) RF/6A cells were pretreated with different concentrations of fenofibrate for 1 h and then exposed to 1.0 mM PQ for 24 h. The x-axis and y-axis represent annexin V-FITC and propidium iodide (PI) staining, respectively. PQ: 1.0 mM PQ; F25: 1.0 mM PQ with 25 µM fenofibrate; F50: 1.0 mM PQ with 50 µM fenofibrate; F75: 1.0 mM PQ with 75 µM fenofibrate; F100: 1.0 mM PQ with 100 µM fenofibrate. (b) Percentage of apoptotic cells treated with different concentrations of fenofibrate. (** p < 0.01 between the control group and 1.0 mM PQ-stimulated group using Mann–Whitney U-test; # p < 0.05, ## p < 0.01 compared to only 1.0 mM PQ-stimulated group using Kruskal–Wallis test with post hoc Dunn’s test; n = 3 in each group).

