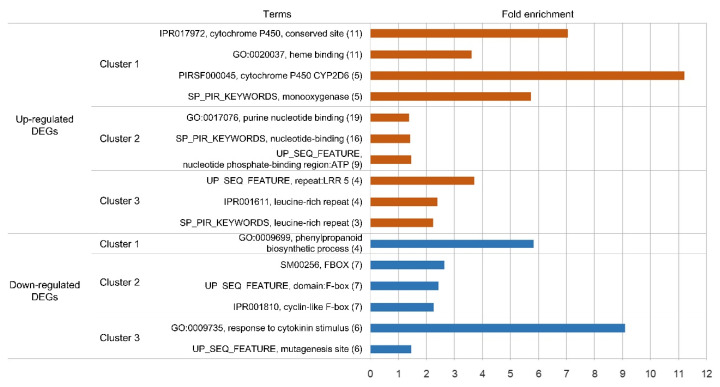
Figure 6.
Highest-ranked functional clusters for differentially expressed genes (DEGs) determined using the DAVID gene functional classification tool. In each cluster, only one term showing the highest fold enrichment value was selected from each functional annotation source and shown in this figure. The number of unigenes annotated with each term is shown in parentheses. Information for all terms in these clusters is presented in Tables S4 and S5.

