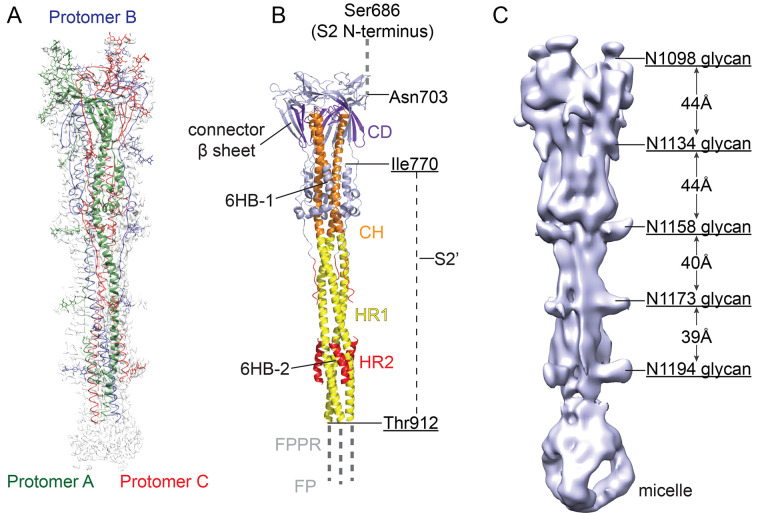
Fig. 4. Cryo-EM structure of the SARS-CoV-2 S2 in the postfusion conformation.
(A) The structure of the S2 trimer was modeled based on a 3.3Å density map. Three protomers (A, B, and C) are colored in green, blue and red, respectively. (B) Overall structure of the S2 trimer in the postfusion conformation shown in ribbon diagram. Various structural components in the color scheme shown in Fig. 1A include HR1, heptad repeat 1; CH, central helix region; CD, connector domain; and HR1, heptad repeat 2. The S2’ cleavage site is in a disordered loop between Ile770 and Thr912. Possible locations of the S2 N terminus (S1/S2 cleavage site), the FP and FPPR are also indicated. (C) A low-resolution map showing the density pattern for 5 N-linked glycans, with almost equal spacing along the long axis.

