
Fig 3a.
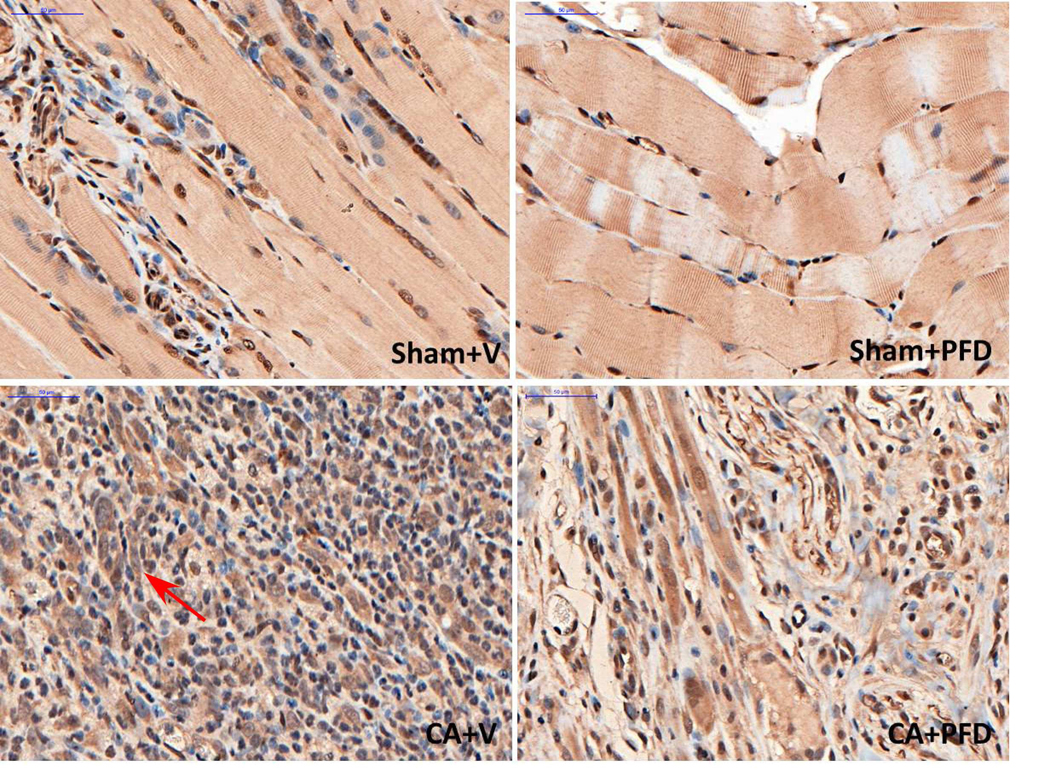
TGFβ1 staining (original magnification, ×40) shows TGFβ1 expression at the border zone 14 days after cryoablation in different groups (five mice per group, scale bar = 200 μm). Marked local TGFb1 staining (arrow) is noted.
Official websites use .gov
A
.gov website belongs to an official
government organization in the United States.
Secure .gov websites use HTTPS
A lock (
) or https:// means you've safely
connected to the .gov website. Share sensitive
information only on official, secure websites.
TGFβ1 staining (original magnification, ×40) shows TGFβ1 expression at the border zone 14 days after cryoablation in different groups (five mice per group, scale bar = 200 μm). Marked local TGFb1 staining (arrow) is noted.