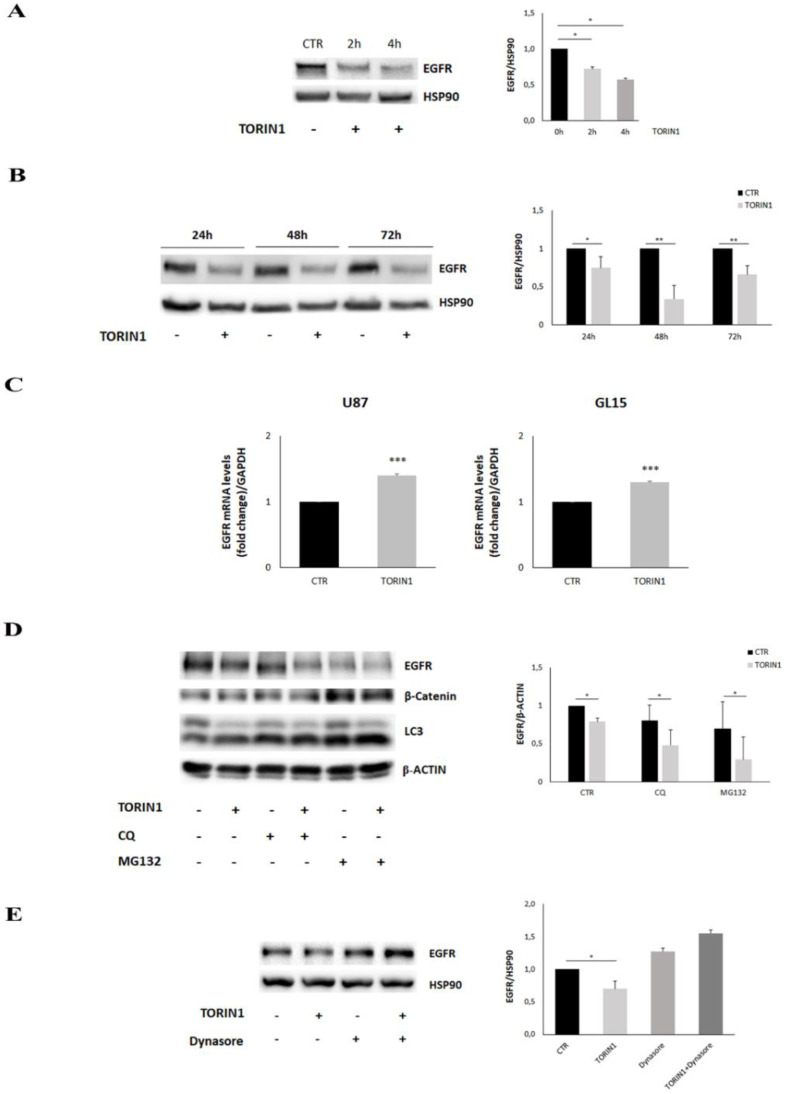
Figure 4.
mTOR inhibition leads to a reduction of EGFR expression in GBM cells. (A,B) U87MG cells were cultured in complete DMEM medium in the presence (TORIN1) or absence (CTR) of 250 nM Torin1 and analysed at the indicated time points. Western blot analyses were performed by using a specific antibody for EGFR. HSP90 was used as loading control. (C) Real time experiments were performed on U87MG and GL15 cells stimulated or not with 250 nM Torin1 for 24 h. GAPDH was used as internal control. The graph represents the mean ± SD of three different experiments: *** p < 0.001 Student t-test. (D) U87MG cells were stimulated (+) or not (−) with 250 nM Torin1 for 24 h in the presence of 20 μM Chloroquine (CQ) or 3 μM MG132 and Western blot analyses were performed by using antibodies for EGFR, β-catenin, LC3 and β-actin. (E) U87MG cells were stimulated (+) or not (−) with 250 nM Torin1 for 24 h in the presence of 100 μM Dynasore and Western blot analysis was performed by using antibodies for EGFR and HSP90 was used as loading control. The graphs represent the mean ± SD of three different experiments. Statistical significance: * p < 0.05 Student t-test ** p < 0.01 Student t-test.

