Figure 7.
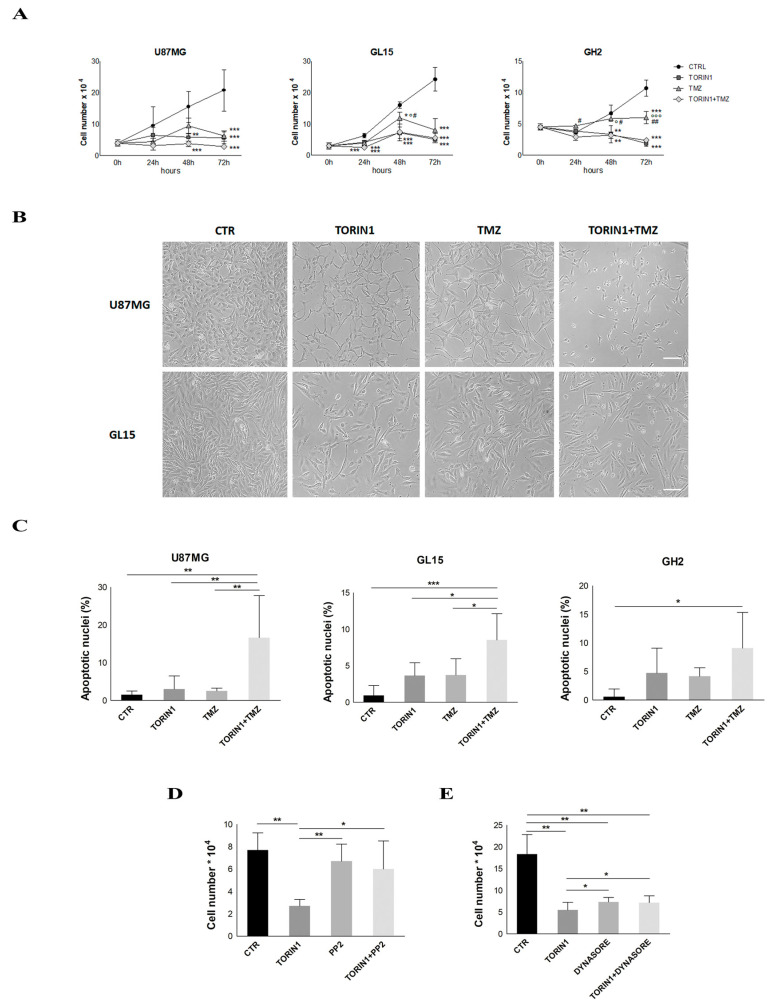
mTOR inhibition leads to cell proliferation arrest. (A) U87MG, GL15 and GH2 cells were cultured in complete DMEM (CTR) or in the presence of 250 nM Torin1 (TORIN1) or 500 µM Temozolomide (TMZ) or both. At the indicated time points, cells were trypsinised and counted in a Newbauer chamber. The graph represents the mean ± Standard Error of the Mean (SEM) of three different experiments. Statistical significance: * indicates significance vs. Ctr; # indicates significance vs. Torin1 + TMZ; ° indicates significance vs. Torin1. ** p < 0.01 *** p ≤ 0.001 Two-way ANOVA. (B) Pictures of the cells in (A) were taken at 72 h of the indicated treatments. Scale bar: 100 µm (C) U87MG, GL15 and GH2 cells were cultured in complete DMEM (CTR) or in the presence of 250 nM Torin1 (TORIN1) or 500 µM TMZ or both Torin1 and TMZ for 72 h. Nuclei were then stained with DAPI and counted under fluorescence microscope (20× objective). 10 fields per each condition were counted. The graphs represent the mean ± SD of three different experiments. * p < 0.05, ** p < 0.01, *** p ≤ 0.001 One-way ANOVA; (D,E) U87MG cells were incubated with Torin1 in the presence or absence of 20 µM PP2 (D) or in the presence of 100 μM Dynasore (E) for 48 h before cell counting in a Newbauer chamber. The graphs represent the mean ± SD of three different experiments. Statistical significance: * p < 0.05, ** p < 0.01 One-way ANOVA.

