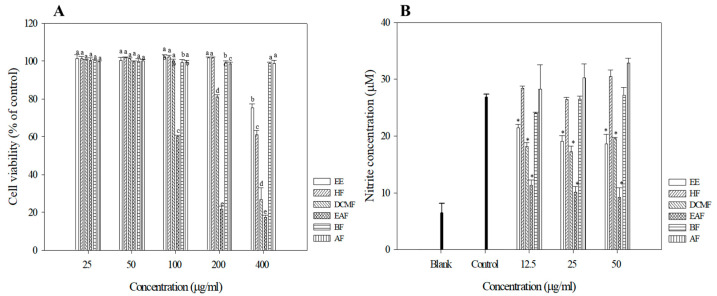
Figure 1.
Cell viabilities of R crispus extracts and solvent fractions. (A) NO production (B) in Raw 264.7 cells. RAW 264.7 cells were treated with various concentrations (25, 50, 100, 200, 400 μg/mL) of R. crispus extracts and fractions for 24 h. Cell viability was measured by MTT assay. RAW 264.7 cells were pre-incubated with 12.5, 25, and 50 μg/mL of extracts and fractions for 1 h and then treated with 1 μg/mL of LPS for 24 h. The NO production was measured by the Griess reagent system. Data are represented as means ± SEMs. The different superscripts are significantly different at p < 0.05. * Statistical significance of the difference between LPS and LPS + sample treatment groups: * p < 0.05.

