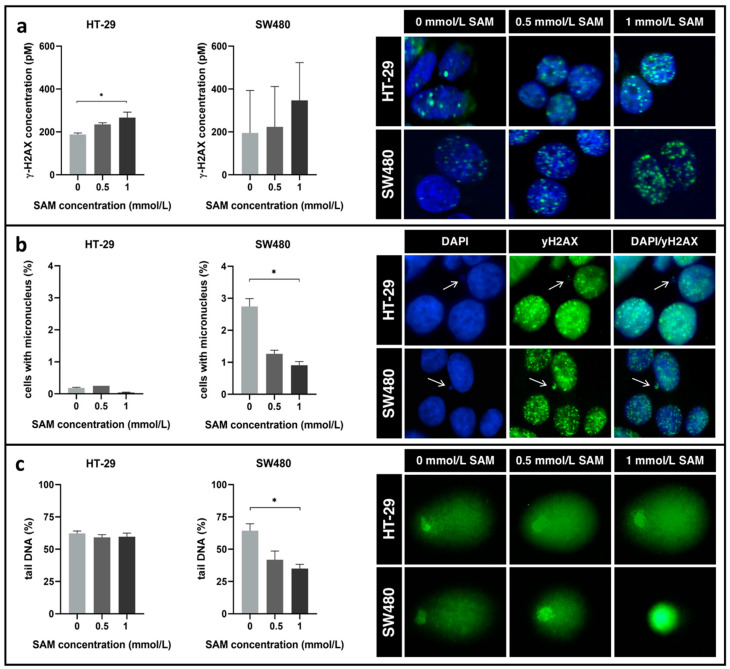
Figure 4.
(a) Left: Concentration of γ-H2AX was determined with ELISA. Right: Representative immunofluorescence staining images of γ-H2AX intensity following SAM treatment were captured. (b) Left: Micronucleus scoring was performed on the slides stained with DAPI and anti-γ-H2AX (* p ≤ 0.05). Right: Arrows indicate representative micronuclei with γ-H2AX positivity. (c) Left: Percentage of DNA in the tail was referred as comet tail DNA % (* p ≤ 0.05). Right: Characteristic comets are visualized following SAM treatment.

