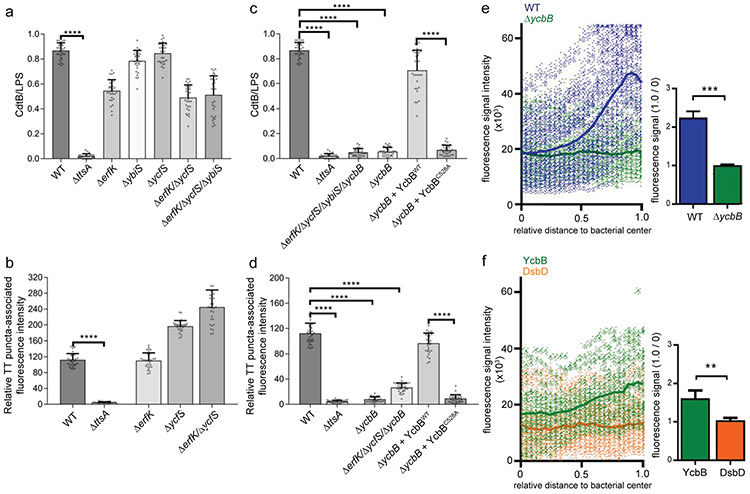
Figure 5. YcbB-dependent peptidoglycan editing is required for typhoid toxin translocation across the bacterial envelope.
(a-d) Contribution of LD-transpeptidases to typhoid toxin translocation. S. Typhi (CdtB-FLAG) strains carrying the indicated mutations were grown for 24 hs in TTIM, fixed, and stained as indicated in Fig. 3. The average ratios of the green/red fluorescence intensity ± standard deviation are shown (**** p < 0.0001, two-sided Student’s t Test) (Supplementary data set 5) (a and c). Alternatively, Henle-407 cells were infected with the indicated S. Typhi strains and 24 hs post infection the infected cells were fixed and stained as indicated in Fig. 3. The quantification of the fluorescence intensity of typhoid toxin-associated fluorescent puncta in infected cells is shown (b and d). Values represent relative fluorescence intensity and are the mean ± standard deviation (****: p < 0.0001, two-sided Student’s t test (Supplementary data set 5). (e) YcbB-dependent polar remodeling of the peptidoglycan layer. S. Typhi wild-type or the isogenic ΔycbB mutant were grown in TTIM for 24 hs, and metabolically labeled by the addition of alkyne-D-alanine (2mM) for 240 minutes as indicated in Fig. 4. The scatter plot shows the results of the line scan analysis of fluorescence intensity along the axes of individual bacterial cells for wild-type (blue) and the ΔycbB (green) S. Typhi strains carried out as described in Fig. 2. The blue or green line depicts the average of the intensities measured at each of the measuring points. Bar graph shows the average ratios of the signal intensities measured at the point furthest from the center (1.0) to the signal intensities measured at the center (0) of each bacterium. Numbers represent the mean ± standard deviations from 1,800 measurements (*** p < 0.001, Student’s t Test) (Supplementary data set 5). (f) YcbB is enriched at the bacterial poles. S. Typhi (YccB-FLAG) strains expressing FLAG-tagged YcbB (green) or DsbD (orange) were grown for 24 hours in TTIM, fixed, and stained with a mouse antibody directed to the FLAG-epitope. The scatter plot shows the fluorescence signal intensities and average intensities (lines) for the indicated proteins as described in Fig. 3. The bar graph shows the average ratios of the signal intensities measured at the point furthest from the center (1.0) to the signal intensities measured center (0) of each bacterium. Numbers represent the mean ± standard deviation from 1,800 measurements (** p < 0.01, two-sided Student’s t Test) (Supplementary data set 5). All data in (a-f) were derived from at least three independent experiments.

