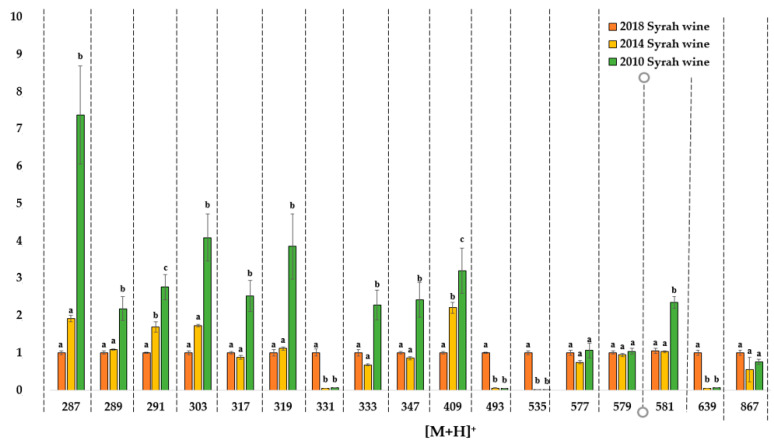
Figure 4.
Natural oxidation samples. Ion intensity comparison of high-resolution MS spectra. Intensities for the three wine samples (2018, 2014 and 2010) are given for each [M+H]+ ion and normalized compared to the 2018 sample values. Figures are expressed as mean values (n = 3) with standard deviation. Different letters indicate a significant difference (Tukey test, α = 0.05) between vintages for a same [M+H]+ ion. Data are available in supplementary data: Tables S20–S22.

