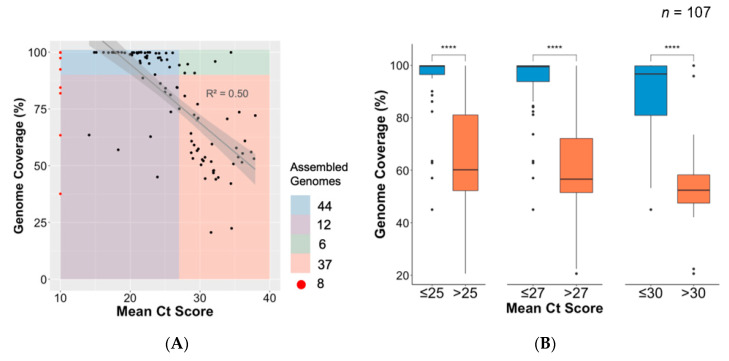
Figure 3.
Association between cycle threshold (Ct) value and genome length. (A) Regression plot of mean Ct value of all unique samples against their genome lengths (% coverage against SARS-CoV-2 reference). Samples with missing Ct value information (n = 8) are shown in red. Forty-four assembled genomes of >90% were produced from samples having Ct value <27 (blue); six genomes of >90% and Ct value >27 (green); 12 genomes <90% coverage and Ct value <27 (purple); and 37 genomes <90% coverage and Ct value >27 (orange). (B) Box plot and statistical comparison of genome coverage obtained from samples grouped in three mean Ct value thresholds (25, 27, and 30), showing statistically significant (t-tests) differences between lower and higher Ct value samples. ****: level of significance.

