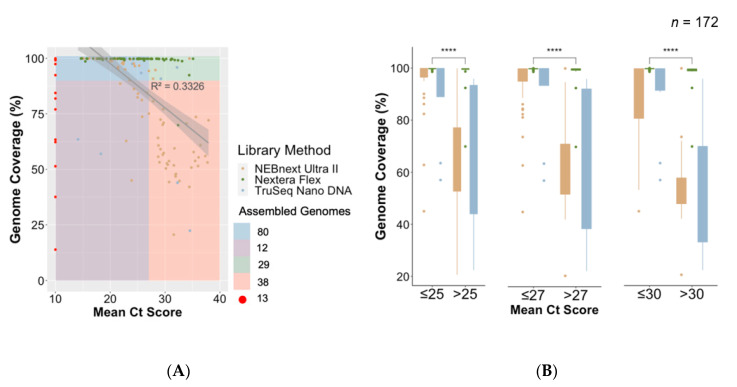
Figure 4.
Association between Ct value and genome length by library preparation method. (A) Regression plot of mean Ct value of all unique samples against their genome lengths (% coverage against SARS-CoV-2 reference). Samples with missing Ct value information (n = 8) are shown in red. A total of 114 assembled genomes of >90% were produced (80 with Ct value <27, 29 with Ct value >27, and five with missing Ct values). (B) Box plot and statistical comparison of genome coverage obtained from samples grouped in three mean Ct value thresholds (25, 27, and 30) by library preparation method, showing statistically significant (t-tests) differences between lower and higher Ct value samples. ****: level of significance.

