Figure 1.
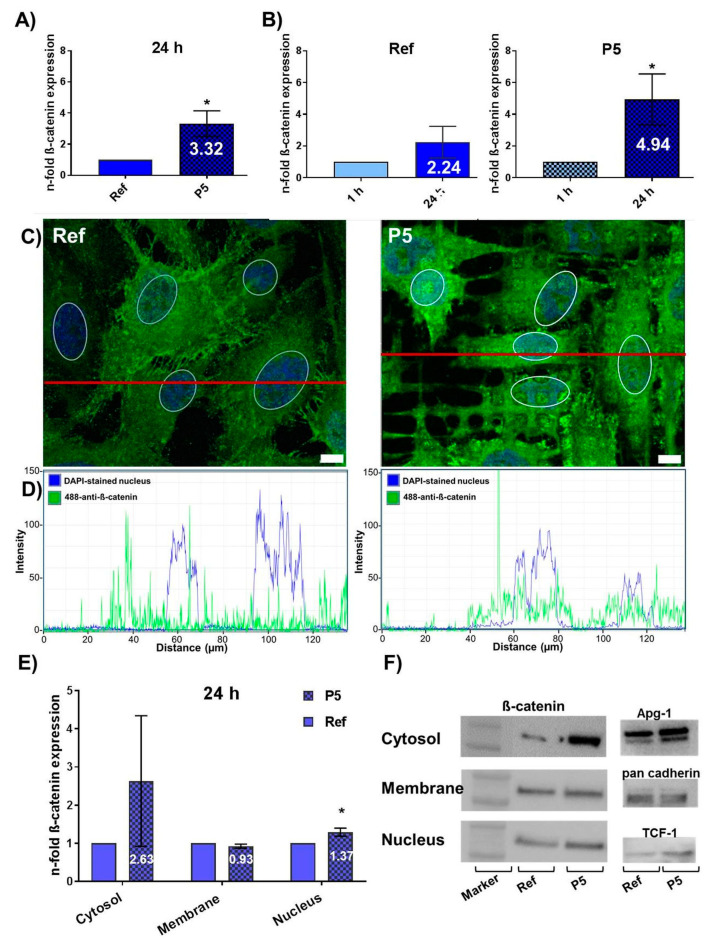
The β-catenin protein expression and localization in MG-63 osteoblasts on micro-pillars (P5). (A) Flow cytometric analysis of β-catenin total protein level in MG-63s after 24 h. Note that β-catenin was significantly increased in MG-63s on P5. (FACSCalibur, BD Biosciences; Ref values normalized to 1; mean ± s.e.m. of 4 independent experiments; Mann-Whitney U test; * p < 0.05). (B) Flow cytometric analysis of the time dependent β-catenin total protein expression after 1 h and 24 h on Ref and P5. Note that the expression of β-catenin on P5 was significantly increased after 24 h compared to 1 h, which indicated the accumulation of the protein. (FACSCalibur, BD Biosciences; 1 h values normalized to 1; mean ± s.e.m. of 4 independent experiments; Mann-Whitney U test; * p < 0.05). (C) Immunofluorescence of β-catenin in MG-63s on P5 compared with unstructured Ref after 24 h (green: Alexa Fluor® 488-anti-β-catenin, blue: nucleus, DAPI (4′,6-diamidino-2-phenylindole); LSM 780, Carl Zeiss; magnification 63×, P5 immunofluorescent image is 3D confocal z-stack overlay, scale bar: 10 µm). Note that on Ref, the MG-63s showed a homogeneous distribution of β-catenin in the cell. On P5, β-catenin was mainly distributed in the cytosol and translocation in the nucleus was visible. (D) Profile of fluorescence intensity recorded at specific region across the fluorescence images (red line, 1C). Note on P5 the β-catenin profile (green) is detectable in the cytosol as well as in the nucleus (blue) with the same intensity. In contrast, on Ref the intensity of β-catenin (green) can rarely be detected in the core regions (blue). (Zeiss, ZEN function “Profile”; Pinhole section: 0.7 µm). (E) Immunoblotting of cell lysates of subcellular fractions and detection of β-catenin (24 h). Note that MG-63s on P5 indicated a trend to higher expression of β-catenin in the cytosol, and a significantly increased expression in the nucleus. (Ref values normalized to 1; mean ± s.e.m., 4 independent experiments; multiple t-test; * p < 0.05). (F) Representative Western blot bands of the β-catenin level (92 kDa) in MG-63s fractions on P5 compared to Ref (one out of four experiments, marker: upper line = 100 kDa; lower line: 75 kDa). On the right side, the selected marker proteins for the corresponding subcellular fraction are presented: cytosol—Apg1 (Heat Shock Protein Family A), membrane—pan-cadherin and nucleus—TCF-1 (T cell factor1).

